
Project Goal
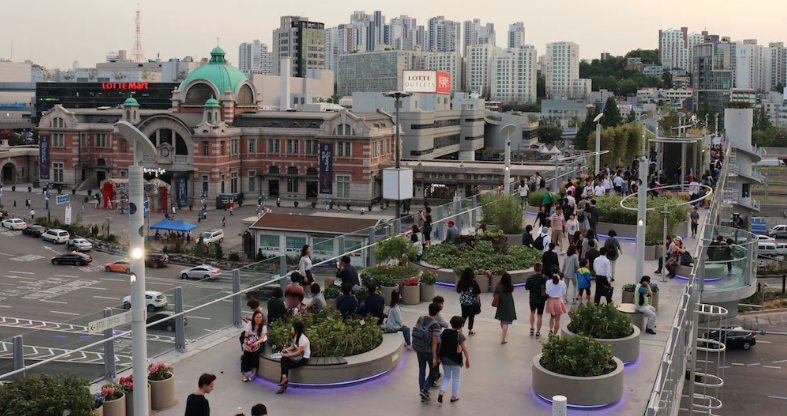
Seoullo 7017 Bridge, Seoul, April 12, 2018: analysis of visitors’ footfall, duration of stay and population density versus holidays and outside temperature correlation, in 4 different parts of the Seoullo 7017 Bridge in Seoul, Korea.
.
Key findings
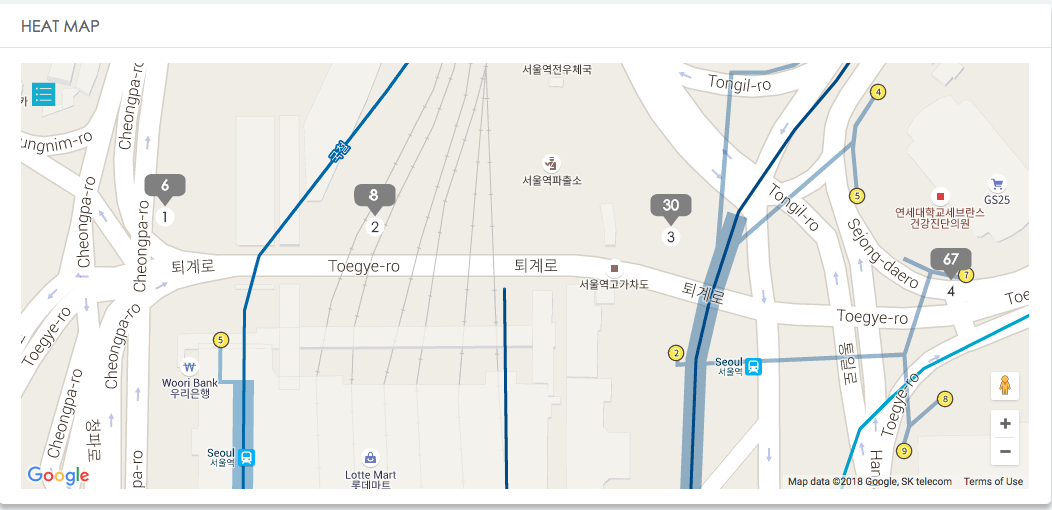
Four LBASense Crowd Analytics sensors were deployed onsite, detecting passively and anonymously mobile phone signals, allowing to count in real-time the number of persons located in four areas of the bridge.
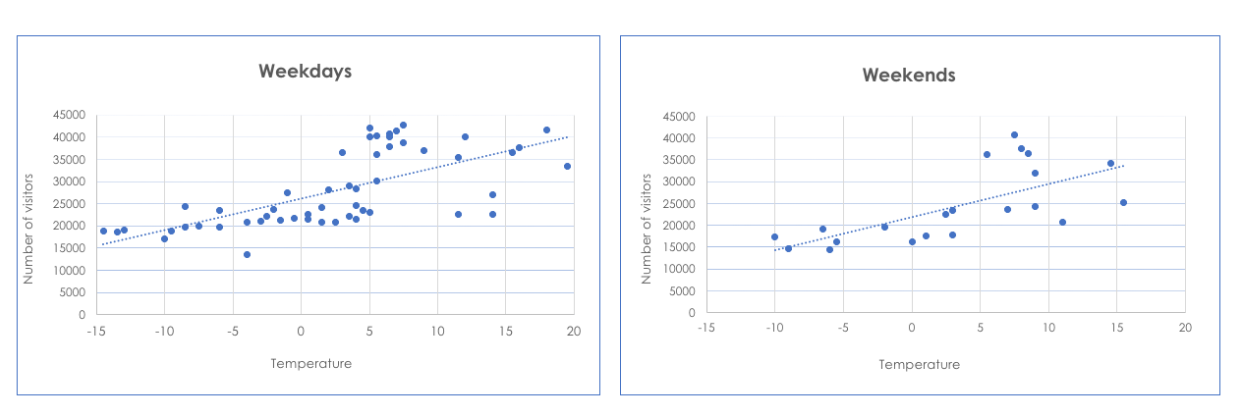
Over the entire winter, the data analysis, from January to March 2018, showed that the temperature had an impact on the decision to have a walk on the touristic bridge.
Results show that people’s behaviour is different from weekends and weekdays, considering additional factors like work and free time as drivers in the decision-making process.
On top of that, warmer temperatures seem to invite people on Seoullo Bridge, increasing the crowd of 50% on average (55% over weekends, 45% over weekdays).
Based on these results, predictions could be built in order to provide tourism businesses such as festival organisers with detailed weather/crowd predictions.
Credits: Cover image By 한국어: 분당선M [CC BY-SA 3.0], from Wikimedia Commons; LBASense images © by DFRC, April 2018.
Interested in deploying a similar system to analyse the crowd in your city? Contact us for more information, we will be happy to help.